“I feel lucky to be around so much water and all the opportunity that comes with it.”
Paul Dearlove
PAUL DEARLOVE Deputy Director
Paul Dearlove joined Clean Lakes Alliance in 2014 and is the organization’s Deputy Director. His primary focus is on advancing community-based phosphorus reduction actions, and to empower citizen participation by creating opportunities for people to become more informed and involved as donors, advocates and volunteers.
Paul’s work includes overseeing the organization’s education and engagement programs, including citizen water quality monitoring, Renew the Blue Volunteer Days, State of the Lakes reporting, Lake Explorer Camp, Yahara Lakes 101, and the Yahara Watershed Academy. He also plays a lead role in promoting initiatives related to the Yahara CLEAN Strategic Action Plan.
Prior to joining Clean Lakes Alliance, Paul spent 15 years as Lake Manager for the Lake Ripley Management District (Jefferson County, WI). His work included directing the completion of a 13-year Priority Watershed Project through the Wisconsin Nonpoint Source Abatement Program. He also worked as a consultant preparing comprehensive lake and watershed management plans for Wisconsin lake organizations.
Paul earned his M.S. in Water Resources Management from the University of Wisconsin-Madison’s Nelson Institute for Environmental Studies. He has also served on the boards of Wisconsin Lakes and the Friends of Lake Wingra.
Paul is an avid angler who lives within a short walking distance of Lake Wingra. He grew up exploring lakes and has always been fascinated by the unique underwater worlds they support. One of the primary reasons for choosing Madison as a place to live is because it is surrounded by water.
Paul Dearlove joined Clean Lakes Alliance in 2014 and is the organization’s Watershed Initiatives Senior Director. His primary focus is on advancing community-based phosphorus reduction actions, and to empower citizen participation by creating opportunities for people to become more informed and involved as donors, advocates and volunteers.
Paul’s work includes overseeing the organization’s education and engagement programs, including citizen water quality monitoring, Renew the Blue Volunteer Days, State of the Lakes reporting, Lake Explorer Camp, Yahara Lakes 101, and the Yahara Watershed Academy. He also plays a lead role in promoting initiatives related to the Yahara CLEAN Strategic Action Plan.
Prior to joining Clean Lakes Alliance, Paul spent 15 years as Lake Manager for the Lake Ripley Management District (Jefferson County, WI). His work included directing the completion of a 13-year Priority Watershed Project through the Wisconsin Nonpoint Source Abatement Program. He also worked as a consultant preparing comprehensive lake and watershed management plans for Wisconsin lake organizations.
Paul earned his M.S. in Water Resources Management from the University of Wisconsin-Madison’s Nelson Institute for Environmental Studies. He has also served on the boards of Wisconsin Lakes and the Friends of Lake Wingra.
Paul is an avid angler who lives within a short walking distance of Lake Wingra. He grew up exploring lakes and has always been fascinated by the unique underwater worlds they support. One of the primary reasons for choosing Madison as a place to live is because it is surrounded by water.
We are more than a quarter of the way through 2019, and the days are starting to warm as we head deeper into the spring season. As the lake season approaches, there are plenty of opportunities to get involved with our lakes.
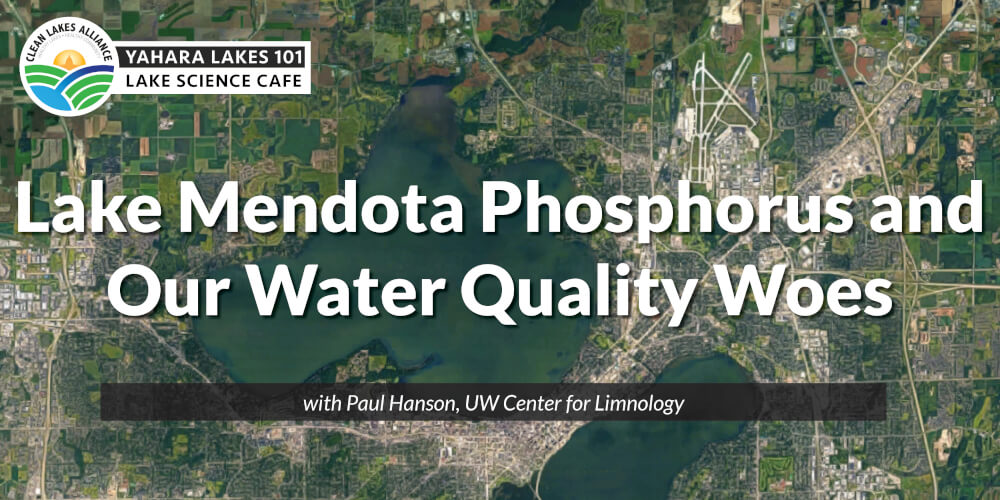
Lake Mendota is a beautiful and beloved waterbody in the Greater Madison Area. Thanks to the UW Center for Limnology, Lake Mendota has been called the most studied lake in the U.S.
Below the surface, Lake Mendota is a dynamic and ever-changing ecosystem. In this month’s Yahara Lakes 101 talk, we’ll hear from Dr. Paul Hanson about the phosphorus dynamics in Lake Mendota and how machine learning can help us better understand the linkages between human decision making and water quality.
Join us for a deeper dive into Lake Mendota!
About our speaker
Dr. Paul C. Hanson is a Distinguished Professor of Research at the University of Wisconsin-Madison Center for Limnology. Dr. Hanson studies lakes and reservoirs as ecosystems embedded in human, landscape, and climate contexts. His work has focused on issues of water quality and how lakes and their services respond to nutrient and carbon inputs from their watershed. Through computer simulations, Dr. Hanson recreates the patterns observed in aquatic systems, and links those patterns to our understanding of the way the bio-physical world works.
His research has led to quantification of the roles that lakes and reservoirs play in the global carbon cycle, new understanding of the linkages between human decision making and water quality, and advancements in water quality prediction through numerical simulation and machine learning. This research has been applied to lakes and reservoirs around the world through his leadership in the Global Lake Ecological Observatory Network (GLEON).
Event details
This event is at The Edgewater. Come at 7:30 a.m. for a meet-and-greet and to enjoy your coffee, pastries, and fruit. The program begins at 8 a.m., and class is dismissed by 9 a.m. Complimentary event parking will be available at The Edgewater.
Admission is FREE for Friends of Clean Lakes. If you are not a Friend, admission is $10 per event. Registration for each event is requested for all attendees.
Yahara Lakes 101 Science Café
Yahara Lakes 101 is a series of educational events open to the public and a great chance for residents to learn more about the science behind the issues that affect our lakes. Each month we feature a different expert to make the science accessible and interesting to non-technical audiences.
The series is produced in partnership with the UW-Madison Nelson Institute for Environmental Studies, with presenting sponsors First Weber Foundation and Johnson Financial Group, hosting sponsor The Edgewater Madison, supporting sponsor National Guardian Life Insurance Company, and media partner the Isthmus.
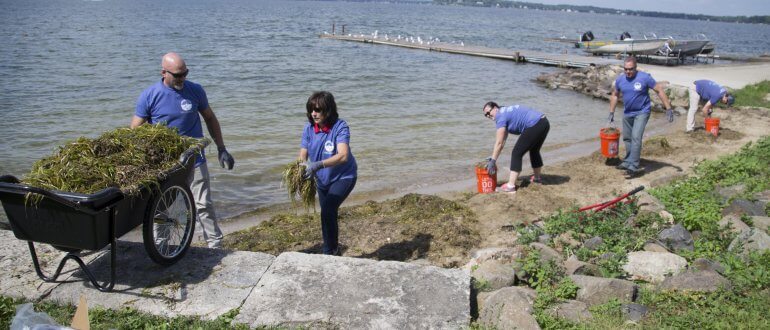
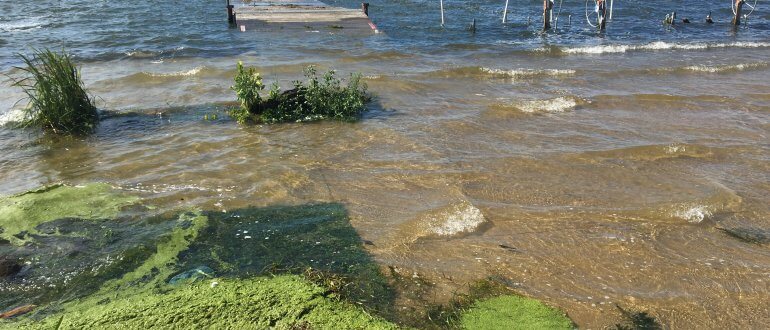
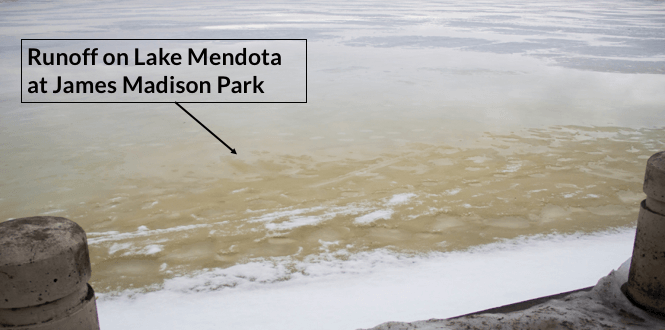
Record rainfall hit Greater Madison this month, and its impacts are far-reaching. Ten to fifteen inches of rain fell across western Dane County in less than 24 hours. The high volume of water is now making its way downstream through the Yahara Watershed, with our lakes reaching historic high levels. See real-time lake levels here.
Urban and rural runoff add algae-creating phosphorus to our lakes
MADISON, Wis. — Warm February temperatures and a high volume of rain are melting snow now, but creating a hazardous problem down the road. Visible runoff can be seen along the shores of all five lakes in our watershed. This brown, discolored water has gathered soil and debris from the frozen land and washed it into our lakes. With more weekend rain in the forecast, this problem will continue to harm Madison’s lakes.
“When we have a deluge of rain in the winter, or a fast thaw, the frozen land can’t accept the water,” said Paul Dearlove, Clean Lakes Alliance senior director of watershed initiatives. “This means more phosphorus has been loaded into the lake, which has the potential to cause more algae blooms this summer.”
About the talk
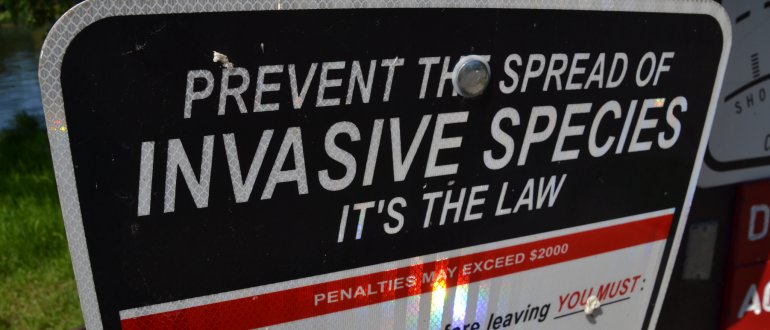
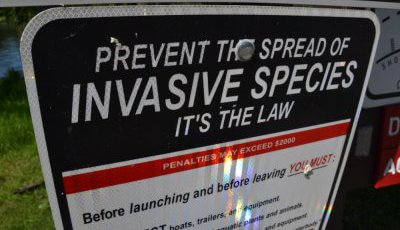
Join us for Yahara Lakes 101 on Wednesday, April 11th for a special talk on invasive species in our lakes. Susan Graham will speak about the scale of the problem, what Wisconsin is doing, what YOU can do to help. We’ll learn about what invaders could be next and what success has looked like right here in Wisconsin.
Aquatic invasive species, otherwise known as “AIS,” are non-native species that can take over, spread primarily by humans, and negatively impact recreation, the economy, and our native ecosystems. Wisconsin has a comprehensive rule called “NR-40” that classifies species that are prohibited, restricted, or not a concern, and guides regulations based on risks. For the Wisconsin DNR, preventing the spread of invasive species relies on a social science understanding of human behavior.
Susan Graham has worked on lake-related issues for 25 years at the Wisconsin DNR and is a great resource for anyone wanting to learn more. Don’t miss this talk!
About our speaker
Susan Graham earned her master’s degree in Water Resources Management from the University of Wisconsin-Madison Nelson Institute for Environmental Studies. She has worked on a variety of lake-related issues in her 25 years at Wisconsin DNR, including water quality assessment, coordinating the statewide Citizen Lake Monitoring Network, and serving on committees to establish phosphorus standards for lakes.
Susan is currently the Lakes Coordinator for DNR’s southcentral region, where she works on aquatic plant management along with monitoring, grants, and policy for lakes and aquatic invasive species. Susan is also part of a team that is creating a tool to prioritize response efforts to invasive species on public lands and waters. Sue is an avid organic gardener and hiker, and loves swimming and paddling when there isn’t ice coating our waters.
About the series
Yahara Lakes 101 is a series of educational events open to the public and a great chance for residents to learn more about the science behind the issues that affect our lakes. Each month we feature a different expert to make the science accessible and interesting to non-technical audiences.
The series is produced in partnership with the UW-Madison Nelson Institute for Environmental Studies, with hosting sponsor The Edgewater, presenting sponsor First Weber Group, supporting sponsor The Evjue Foundation, and media sponsor The Isthmus.
The event is held both indoors and outdoors (weather permitting) at The Edgewater. Come at 7:30 a.m. for a meet-and-greet and to enjoy your coffee, pastries, and fruit. The program begins at 8 a.m., and class is dismissed by 9 a.m. Complimentary event parking will be available at The Edgewater.
Admission is FREE for Friends of Clean Lakes. If you are not a Friend, admission is $10 per event. Registration for each event is requested for all attendees.
Clean Lakes Alliance committees provide expertise on target areas, including implementation, policy, and fundraising.
Apply to serve on a Clean Lakes Alliance committee
To learn more about how to get more involved with Clean Lakes Alliance or our committees, please read our guide to getting involved.
Committee members often have previous experience and involvement with Clean Lakes Alliance, including volunteering or attending events. We’d love to get to know you more and learn from your expertise!
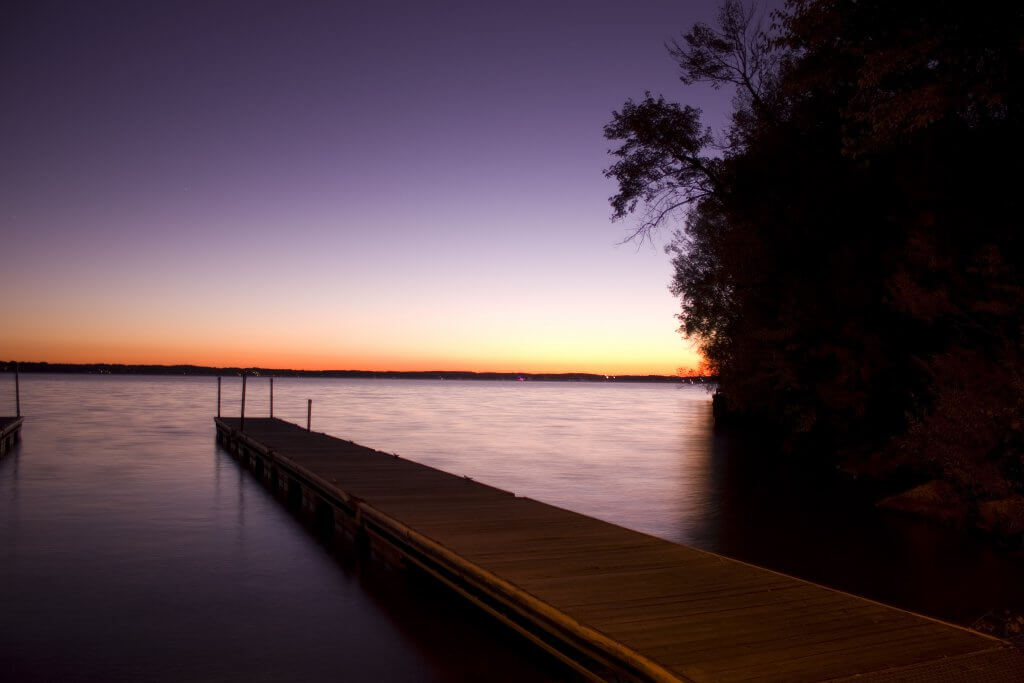
Lake Kegonsa State Park at dusk
Standing committees
Governance Committee:
The Governance Committee vets and recommends candidates for the Executive and Community Boards, provides guidance on committee structure, and advises on Clean Lakes Community Awards.
Economic Impact and Policy Committee (EIPC):
The Economic Impact and Policy Committee assesses the intrinsic/extrinsic value of our lakes to the community, and provides guidance on policy issues with the potential to impact water quality.
Advancement Committee:
The Advancement Committee works to assure that Clean Lakes Alliance has effective development, donor relations, and marketing and communication programs in place.
Committee on Strategic Implementation (CSI):
The Committee on Strategic Implementation serves as a forum of partners and advisors to collaborate on advancing the Yahara CLEAN Strategic Action Plan for Phosphorus Reduction (2012). CSI also helps vet new opportunities, technologies, and approaches that get brought forward.
Finance Committee:
The Finance Committee oversees Clean Lakes Alliance’s fiscal practices and the reporting of the organization’s financial condition. It assists staff in creating an annual operating budget, and, through ongoing oversight, helps ensure that a balanced budget is achieved.
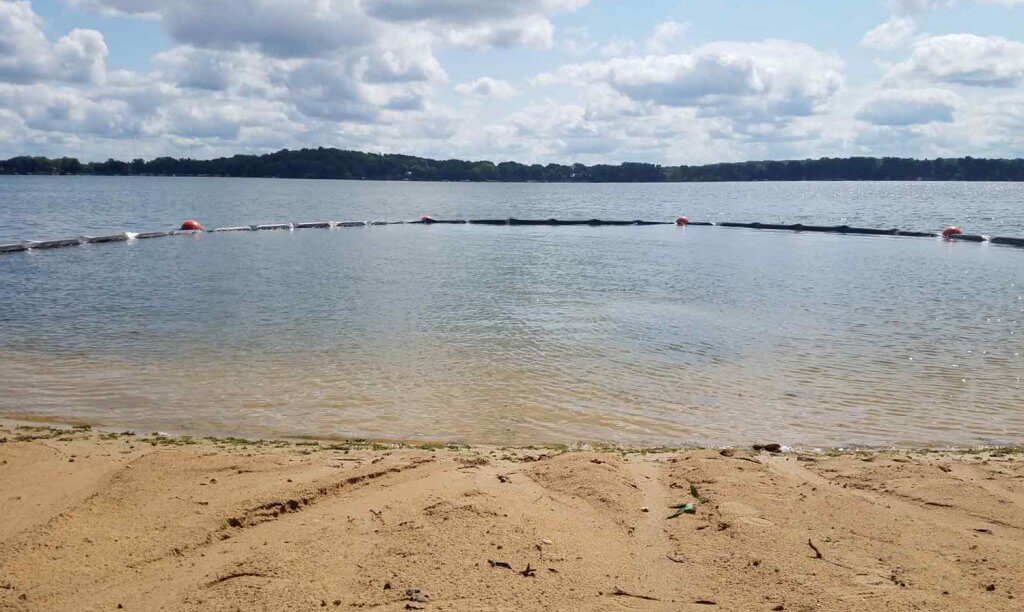
Goodland Beach on Lake Waubesa
Ad-Hoc committees
Loop the Lake Committee:
The Loop the Lake Committee works to fundraise, plan, and execute this unique bike ride along the Lake Monona Lake Loop. Started in 2013, Loop the Lake has grown to an event with more than 1,000 riders.
Fore! Lakes Committee:
This committee oversees the development and execution of the Clean Lakes Alliance Fore! Lakes Golf Outing.
Frozen Assets Committee:
This committee oversees the development and execution of the Clean Lakes Alliance Frozen Assets Fundraiser and Festival.
In Madison, Wisconsin, you can’t “say it all” until you’ve said Mendota, Monona, Wingra, Waubesa and Kegonsa. These five lakes are an integral part of our culture, and one of the major reasons Madison ranks as a “most livable” city year after year. Their waters entice us to visit, work or study here, and often to stay. When our lakes are healthy, our communities can flourish. That is the philosophy behind our work: Healthy Lakes. Healthy Communities.
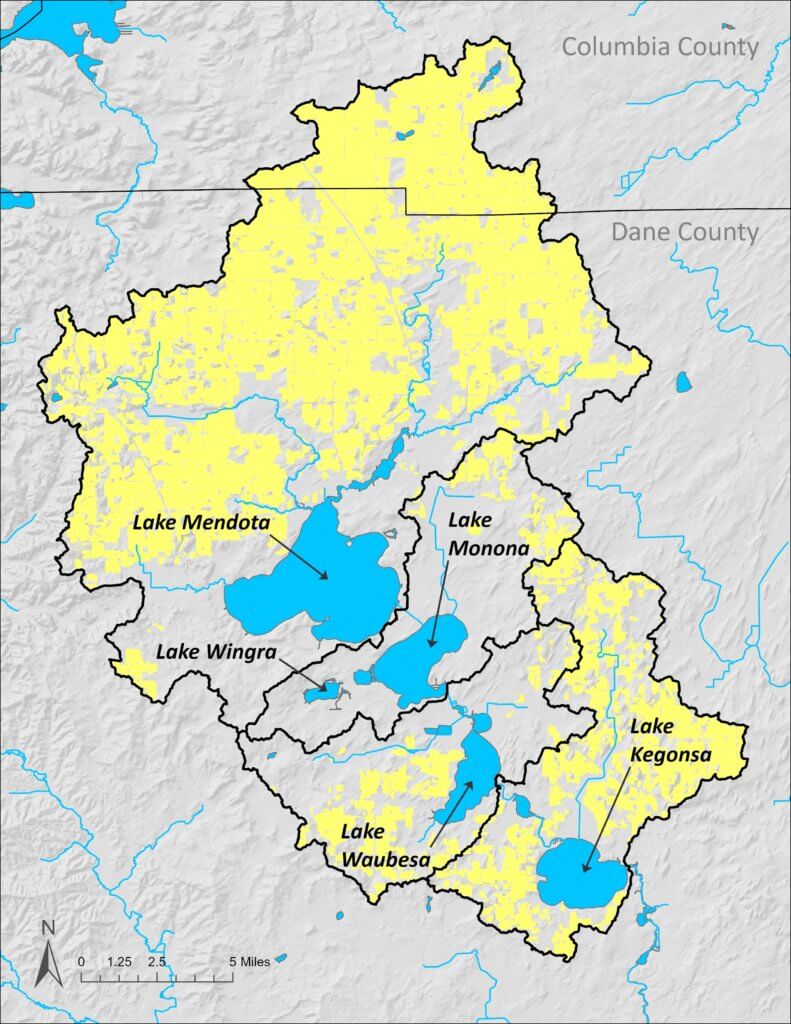
The State of the Lakes provides an annual health synopsis of Greater Madison’s five Yahara lakes (Mendota, Monona, Wingra, Waubesa, and Kegonsa). The chain of lakes and the land areas that drain to them are shown in Figure 1. Focusing on major drivers and indicators of water quality collected over the prior year (2023), the analysis summarizes lake and watershed health factors, trends, and the likely causes of observed conditions. The report begins with lake-specific health dashboards before reviewing five areas of watershed impact and lake response.
Figure 1:Yahara lakes watershed showing land areas that drain directly to each lake. Yellow denotes agricultural areas that comprise most of the 384-square-mile watershed.
2023 key takeaways
Drought conditions limited runoff and phosphorus delivery to the lakes, helping all five lakes attain “good” to “excellent” rankings for phosphorus levels and “good” rankings for water clarity.
LakeForecast monitors observed comparatively fewer nearshore cyanobacteria (blue-green algae) blooms compared to prior years.
Historically rising chloride concentrations caused by winter salting is an ongoing water quality concern, with the highest levels measured in Lake Wingra.
Per- and polyfluoroalkyl substances (PFAS) are an emerging contaminant of concern, with lakes Monona, Waubesa, and Kegonsa recently listed as federally impaired for these forever chemicals.
Progress continues around the adoption of phosphorus-reducing land conservation practices, but more action is needed to reach and sustain water quality goals, including getting 100% of agricultural acres covered by nutrient management plans and developing more manure management facilities.
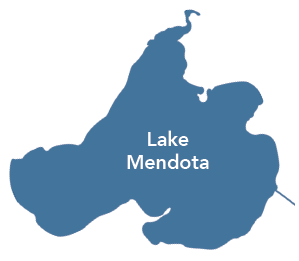
Lake Mendota
Lake Type: Drainage Direct Drainage Area: 217 sq. miles Total Drainage Area: 232.4 sq. miles Surface Area: 9,847 acres Shoreline Length: 22 miles Mean Depth: 42 feet Maximum Depth: 83 feet Volume: 133,407 million gallons Flushing Rate: 22% of volume/year
Lake Mendota sits at the top of the chain and is the largest of the five Yahara lakes by surface area, depth, and volume. Its direct drainage area consists predominantly of agricultural land uses. Inlet tributaries include Pheasant Branch Creek (west shore); and Sixmile Creek, Dorn Creek, Token Creek, and the Yahara River (north shore). The lake’s outlet (southeast shore) directs overflow water through the Yahara River and into Lake Monona. It has been listed as federally impaired for phosphorus since 2011.
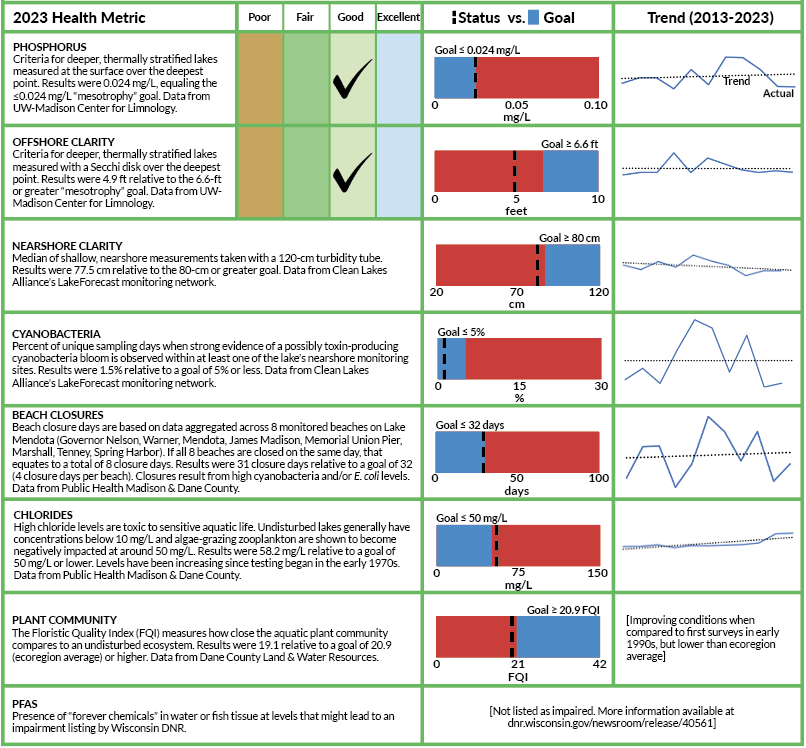
Lake Mendota Health Dashboard
Lake Monona
Lake Type: Drainage Direct Drainage Area: 40.5 sq. miles Total Drainage Area: 278 sq. miles Surface Area: 3,277 acres Shoreline Length: 13 milesMean Depth: 27 feet Maximum Depth: 74 feet Volume: 29,059 million gallons Flushing Rate: 91% of volume/year
Lake Monona is the second largest of the five Yahara lakes by surface area, depth, and volume. It sits immediately downstream of Lake Mendota in the upper half of the chain. The lake’s direct drainage area consists mostly of urban land uses. Inlet tributaries flowing into the lake include Murphy’s (Wingra) Creek (west shore); the Yahara River (north shore); and Starkweather Creek (northeast shore). The lake’s outlet (south shore) directs overflow water through the Yahara River and into Upper Mud Lake and Lake Waubesa. It has been listed as federally impaired for PCBs since 1998, phosphorus since 2011, and PFAS since 2022.
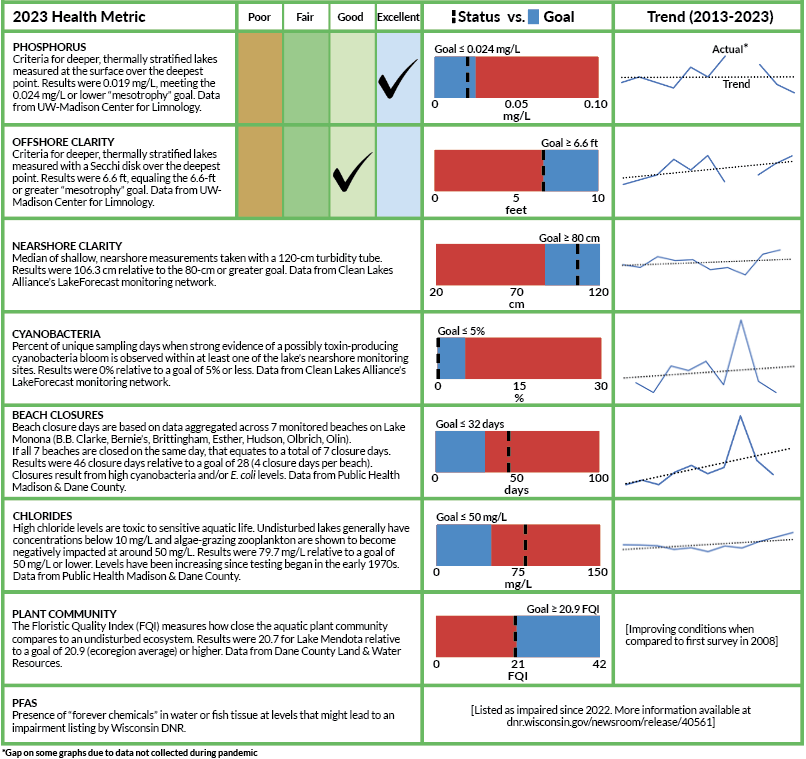
Lake Monona Health Dashboard
Lake Wingra
Lake Type: Drainage Direct Drainage Area: 5.4 sq. miles Total Drainage Area: 5.4 sq. miles Surface Area: 321 acres Shoreline Length: 3.7 miles Mean Depth: 9 feet Maximum Depth: 14 feet Volume: 1,585 million gallons Flushing Rate: 77% of volume/year
Lake Wingra is the smallest of the five major lakes by surface area, depth, and volume. Originally a deep-water marsh, this dredged waterbody now flows into Lake Monona via Murphy’s (Wingra) Creek. The lake’s direct drainage area is located entirely within the city of Madison and dominated by urban land uses. Three minor, unnamed inlet tributaries flow into the lake at points along its west and southwest shore. It has been listed as federally impaired for phosphorus since 2011 and PCBs since 2012.
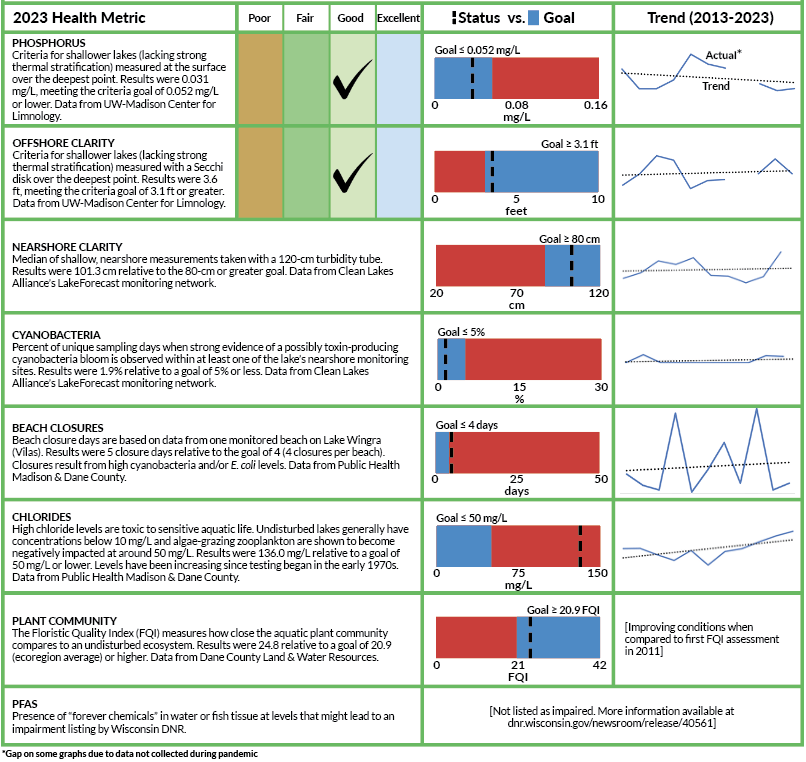
Lake Wingra Health Dashboard
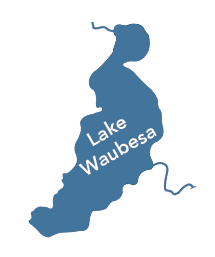
Lake Waubesa
Lake Type: Drainage Direct Drainage Area: 43.6 sq. miles Total Drainage Area: 325 sq. miles Surface Area: 2,083 acres Shoreline Length: 9.4 miles Mean Depth: 15 feet Maximum Depth: 38 feet Volume: 10,567 million gallons Flushing Rate: 320% of volume/year
Lake Waubesa is the fourth largest of the Yahara lakes by surface area and volume. It sits immediately downstream of Upper Mud Lake and Lake Monona in the lower half of the chain. The lake’s direct drainage area is represented by a mix of urban and rural/agricultural land uses. Inlet tributaries that drain into the lake include Nine Springs Creek and Penitto Creek (flowing into Upper Mud Lake to the north); the Yahara River (north shore); as well as Swan Creek and Murphy’s Creek (southwest shore). The lake’s outlet (east shore) directs overflow water through the Yahara River and into Lake Kegonsa. It has been listed as federally impaired for phosphorus since 2011 and PFAS since 2022.
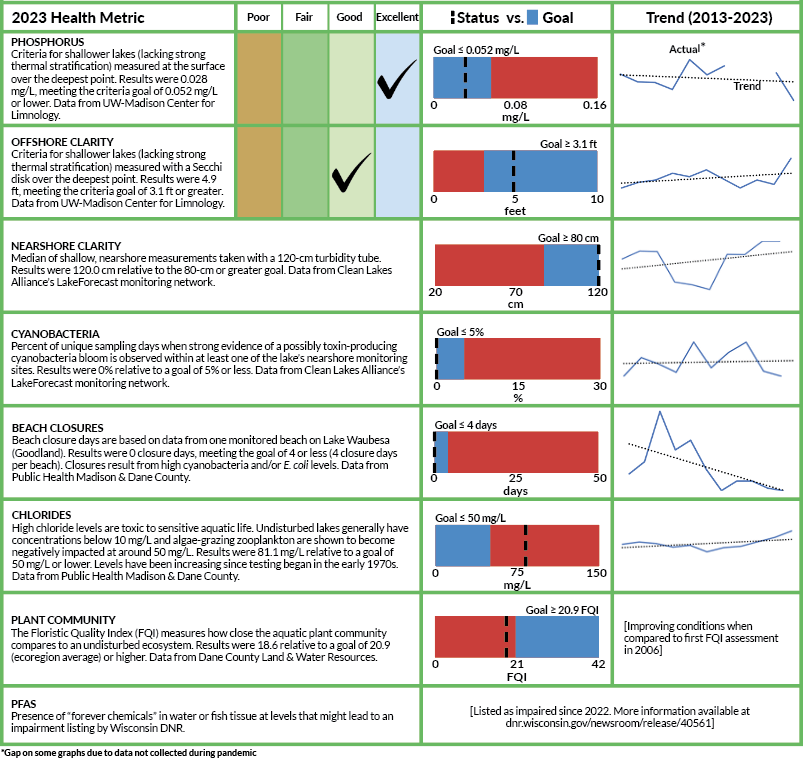
Lake Waubesa Health Dashboard
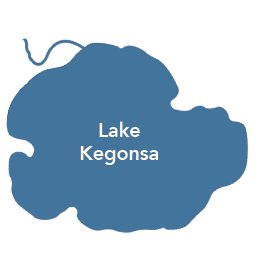
Lake Kegonsa
Lake Type: Drainage Direct Drainage Area: 54.4 sq. miles Total Drainage Area: 384.6 sq. miles Surface Area: 3,210 acres Shoreline Length: 9.6 miles Mean Depth: 17 feet Maximum Depth:32 feet Volume: 17,700 million gallons Flushing Rate: 220% of volume/year
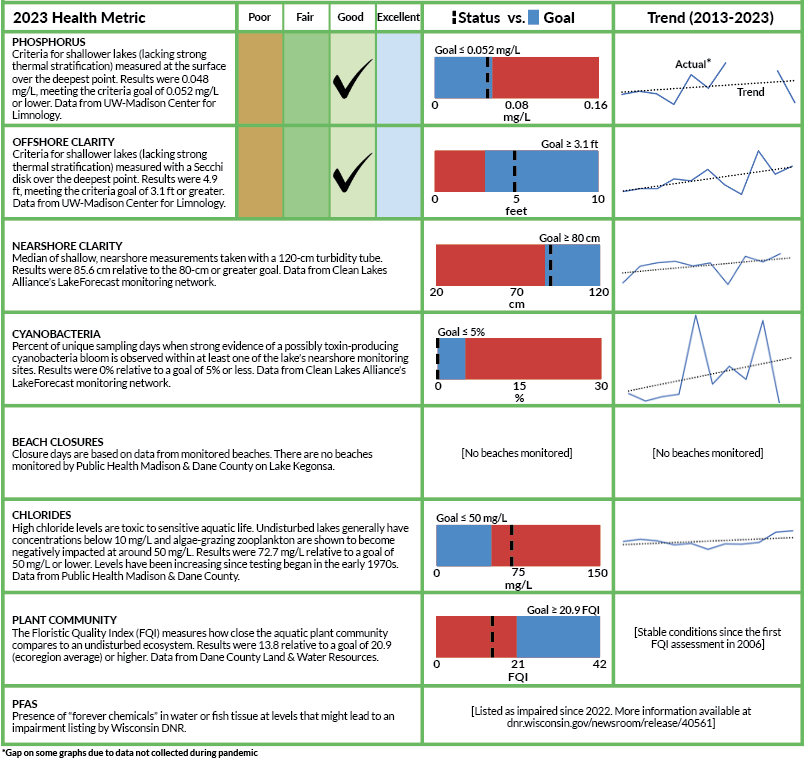
Lake Kegonsa is the third largest of the Yahara lakes by surface area and volume. It sits immediately downstream of Lake Waubesa and Lower Mud Lake in the lower half of the chain. The lake’s direct drainage area consists predominantly of rural/agricultural land uses. Inlet tributaries that drain into the lake include Door Creek (north shore) and two unnamed creeks (southwest and northeast shore). The lake’s outlet (east shore) directs overflow water through the Yahara River toward the Rock and Mississippi Rivers. It has been listed as federally impaired for phosphorus since 2011 and PFAS since 2022.
Watershed health indicators
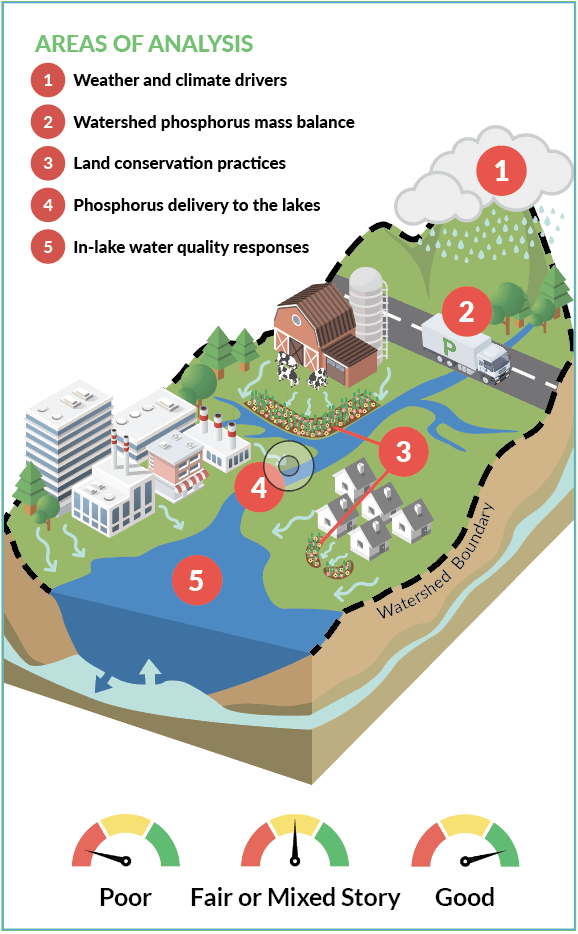
The State of the Lakes assesses five areas of interest that represent vital, interconnected pieces of the larger water quality puzzle. These areas of analysis, illustrated in Figure 2, include both outputs (i.e., land-use actions taken) and outcomes (i.e., measured water quality responses). They were chosen to illustrate critical cause-and-effect principles that play out as water gets funneled through the watershed.
Figure 2:Cross-section illustration of an example watershed showing five areas of analysis. Example scoring dials represent condition status and trend for each area of analysis.
Phosphorus availability and transport are central themes in this analysis given the nutrient’s dominant role in affecting overall lake conditions. Although a natural element essential for plant and animal growth, it can easily harm water quality due to overuse and poor management. Common sources of phosphorus pollution include eroded soil, fertilizer runoff, autumn leaf debris left in city streets, poorly managed livestock manure, sewage releases, and uncollected pet waste. It is estimated that one pound of phosphorus can generate up to 500 pounds of algae growth in our lakes.
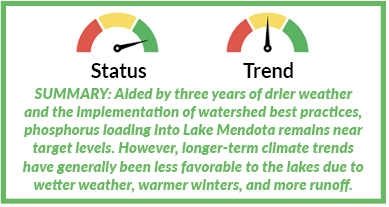
1. Weather and climate drivers
Regardless of whether it’s changes in temperature, precipitation, ice cover, or some other factor, lakes dynamically respond to their environment. Regional heating and cooling patterns influence what types of aquatic organisms can thrive, how and when a lake mixes, and the timing and magnitude of annual freeze cycles. Meanwhile, the timing, intensity, and amount of rainfall falling over the watershed determine what can get moved from the land surface into our waters, including phosphorus-containing materials that fuel algal growth and turn the lakes green.
Winter Season
Winter ice conditions and the timing of ice-off influence everything from water temperatures to the reproductive success of aquatic life. Ice quality and overlying snow depth affect how much sunlight can penetrate to warm the water column and facilitate dissolved oxygen production through photosynthesis. Research by Dr. Zachary Feiner at UW-Madison’s Center for Limnology documents the impacts of early ice-off. As ice-off dates move earlier due to climate change, algae production gets an early start and then collapses right when the daphnia (a type of zooplankton) hatch and are looking for food. This means less zooplankton to eat by juvenile fish and less grazing of algae. Resulting impacts can range from poorer walleye recruitment to more intense algal blooms.
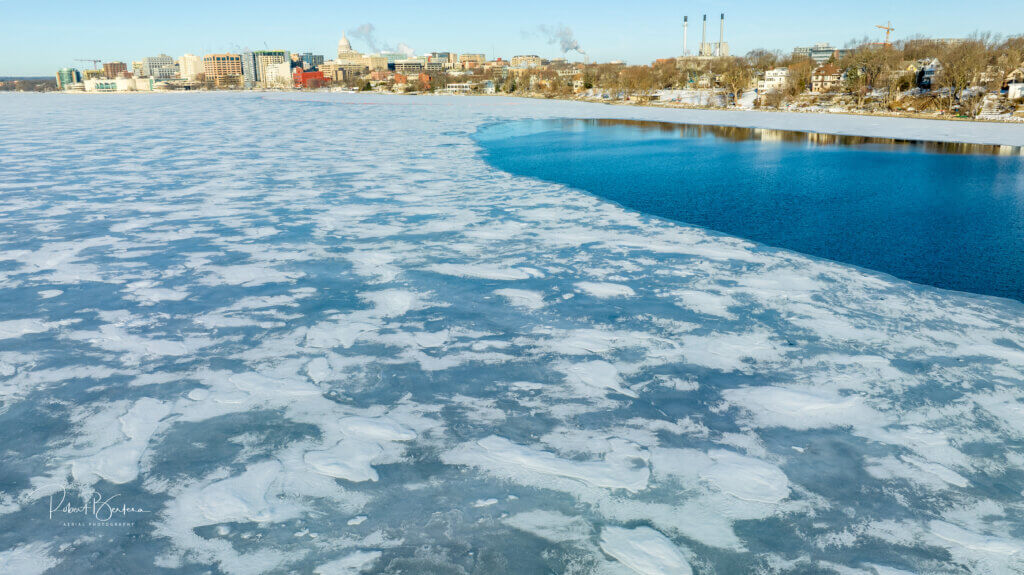
In 2023, Lake Mendota remained frozen for 98 days (12/25/22 – 4/2/23), or 13 days longer than in 2022. This is on par with its median ice-cover duration of 102 days as measured over the last 168 seasons. Historical evidence shows ice-cover durations in decline, with Mendota having lost about a month of ice cover on average since recordkeeping began.
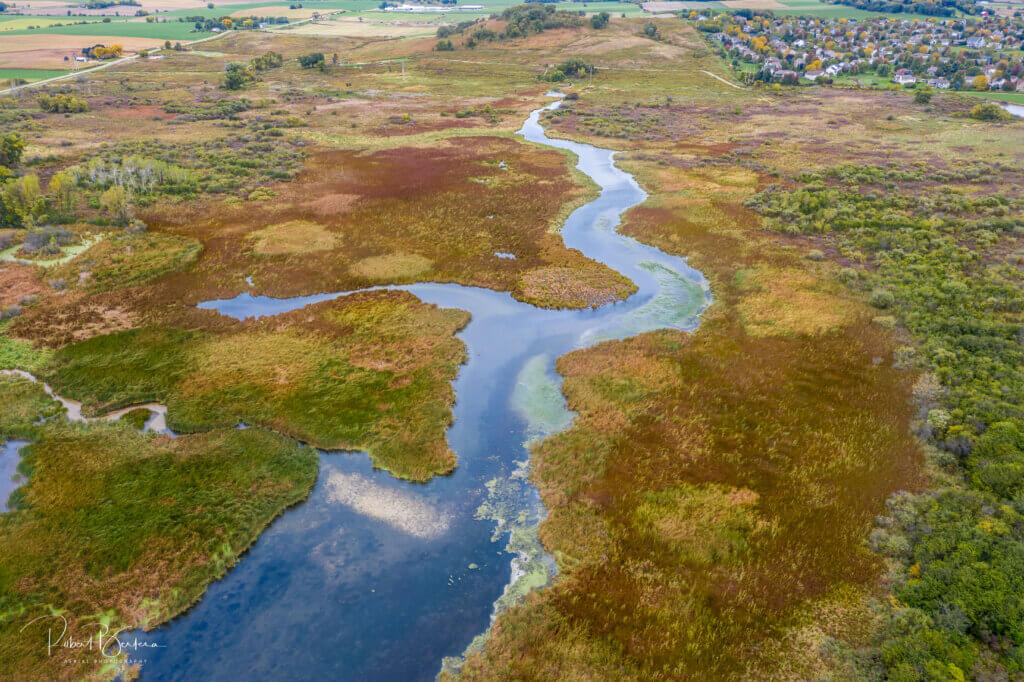
Lake Monona in March 2023, courtesy Robert Bertera
Shorter and warmer winters lead to warmer lake temperatures earlier in the year, effectively creating a longer growing season for algae and aquatic plants. Warmer winters can also contribute to greater runoff and phosphorus delivery when wet precipitation falls on frozen soils. Rather than soak into the ground, rainfall more easily turns into runoff that can carry land-spread manure and other contaminants into the ditches and streams that drain to the lakes. It is estimated that, on average, nearly half of the total phosphorus loading through Lake Mendota’s monitored stream tributaries occurs from January to March, making late winter and early spring a vulnerable time for our lakes.
Warmer Growing Season
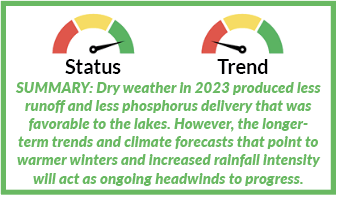
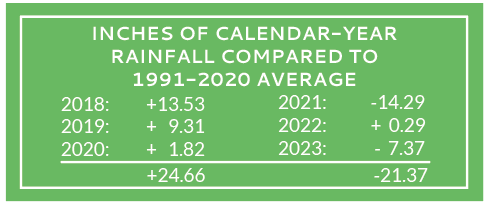
The meteorological summer of 2023 (June 1-August 31) was Wisconsin’s sixth driest on record. Less rainfall leads to less stormwater runoff, meaning less phosphorus washing into our lakes. Based on weather data collected at the Dane County Regional Airport in Madison, the watershed transitioned from a three-year period of above-normal rainfall to a three-year period of below-normal rainfall.
May and June’s collective rainfall totaled only 2.01 inches, compared to the normal 9.38 inches, with only one day receiving 0.50-inch or greater rainfall. The second half of the summer remained dry with July and August collectively experiencing only three days of 0.50-inch or greater rainfall. While July’s 6.21 inches surpassed the monthly normal (4.51 inches), drought conditions persisted with August receiving lower-than-normal rainfall (2.42 inches), further contributing to the already low lake levels. With 2023 capping a three-year period of below-normal rainfall, the impacts of reduced runoff were evident in lower phosphorus delivery (called “loading”) and positive water-clarity responses in all five lakes.
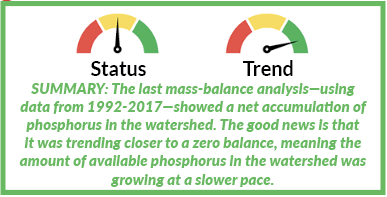
2. Watershed phosphorus mass balance
Calculating the difference between the mass of phosphorus entering (imported into) and leaving (exported from) the watershed tells us whether the net balance is trending in the right direction. The movement and fate of livestock, feed, fertilizer, harvested crops, animal waste, and other phosphorus sources are factored into the analysis. The goal is to attain a negative balance, indicating more phosphorus is being exported than imported on an annual basis. This situation reduces the overall availability of phosphorus from being able to reach area waterways.
Conversely, a positive balance signals an annual net accumulation of phosphorus in the watershed, usually leading to its gradual buildup in area soils. Phosphorus-saturated soils that are subject to erosion and not protected by year-round plant cover can eventually end up at the bottom of nearby lakes and streams. Phosphorus is also more easily “leached” (or released in dissolved form) from these soils when they encounter rainwater and snowmelt.
Past improvements to the overall mass balance are attributed to multiple factors. They include decreases in imported commercial fertilizer, less phosphorus-containing feed supplements consumed by livestock, exported byproducts of manure treatment, and advanced phosphorus-management strategies implemented by Madison Metropolitan Sewerage District (among others). Examples of mass balance detractors include increases in livestock numbers and milk production.
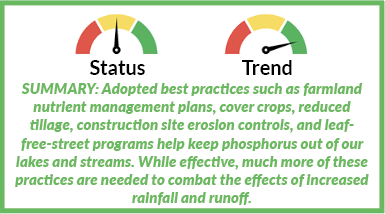
3. Land conservation practices
The adoption of land conservation practices helps minimize the amount of runoff and soil erosion that harms water quality. Examples include preserving and increasing perennial grasslands and natural vegetation, establishing permanent vegetation, maintaining protective cover crops on harvested farm fields, raising livestock on rotationally grazed pastures, and removing fall leaf litter from city streets. In addition, the use of nutrient management plans helps agricultural producers better understand how operational decisions can maximize soil health and productivity while limiting erosion and phosphorus runoff.
Yahara River downstream of Lake Kegonsa, courtesy Robert Bertera
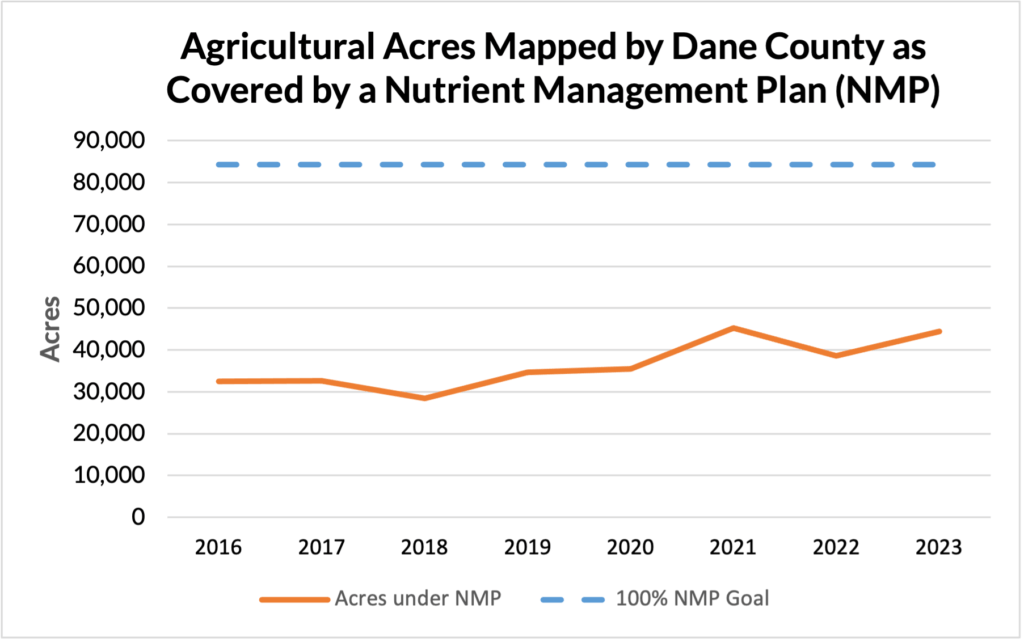
In accordance with state law, nutrient management plans are required on all farms to serve as nutrient-accounting tools, ensuring that manure and fertilizer applications meet crop needs while limiting runoff risks. Based on the latest landowner records filed with Dane County Land & Water Resources (Figure 3), 44,387 out of 84,321 total agricultural acres in the Yahara lakes watershed (53%) were mapped as having a nutrient management plan in 2023 – a 36% increase over just the last seven years. These numbers are believed to be an underrepresentation of the total amount of watershed acres under nutrient management planning since not every plan is recorded with Dane County. Achieving 100% compliance will be a big step forward in attaining related phosphorus reductions that come with sound planning.
Figure 3: Farmland acres in the Yahara lakes watershed that have a nutrient management plan filed with Dane County. Data credit: Kyle Minks, Dane County Land & Water Resources.
Currently, available soil-test information from farmland in the upper half of the watershed has a Rotational Average Phosphorus Index (PI) of 2.8, representing estimated pounds of phosphorus loss per acre per year. The Phosphorus Index is a tool used to assess the potential of phosphorus to move from agricultural fields to surface water, with higher numbers representing greater risk. According to modeling summarized in RENEW THE BLUE: A Community Guide for Cleaner Lakes & Beaches in the Yahara Watershed (2022), a Rotational Average PI of 2.1 or less is needed to reach phosphorus-loading targets and water quality goals in the Yahara lakes. Since 2016, values in the upper watershed north of Lake Mendota have averaged between 2.3 and 3.3. State standards require all fields covered by a Nutrient Management Plan to have a Rotational Average PI of 6 or less.
4. Phosphorus delivery to the lakes
Most phosphorus is delivered to the Yahara chain of lakes through tributary streams that collect and channel upland-generated runoff as it moves downhill. How much is transported depends on the seasonal timing and intensity of runoff events, the location and availability of major phosphorus sources, and measures taken to contain those sources and manage runoff. Over the course of an average year within the past decade, approximately 40% of the total phosphorus load occurred during the months of January, February, and March.
Pheasant Branch Creek flowing into the west side of Lake Mendota, courtesy Robert Bertera
Stream monitoring is used as a tool to evaluate the effectiveness of conservation practices by tracking phosphorus loading. Loading describes the total mass of phosphorus delivered to a specific location in a stream over time. In our case, we characterize loading in pounds of phosphorus (calculated by multiplying in-stream concentrations by streamflow) delivered through Lake Mendota’s monitored stream tributaries in a given “water year” (Oct. 1 – Sep. 30). Perched at the top of the chain and receiving most of the drainage from the Yahara lakes watershed, the condition of Lake Mendota offers a good indicator for how the downstream lakes will be impacted. Lake Mendota is also the largest lake with the greatest number of monitored streams and the most complete long-term dataset. Most of the phosphorus received by the lower lakes in the chain is through the outlets of the upper lakes as it cascades through the system.
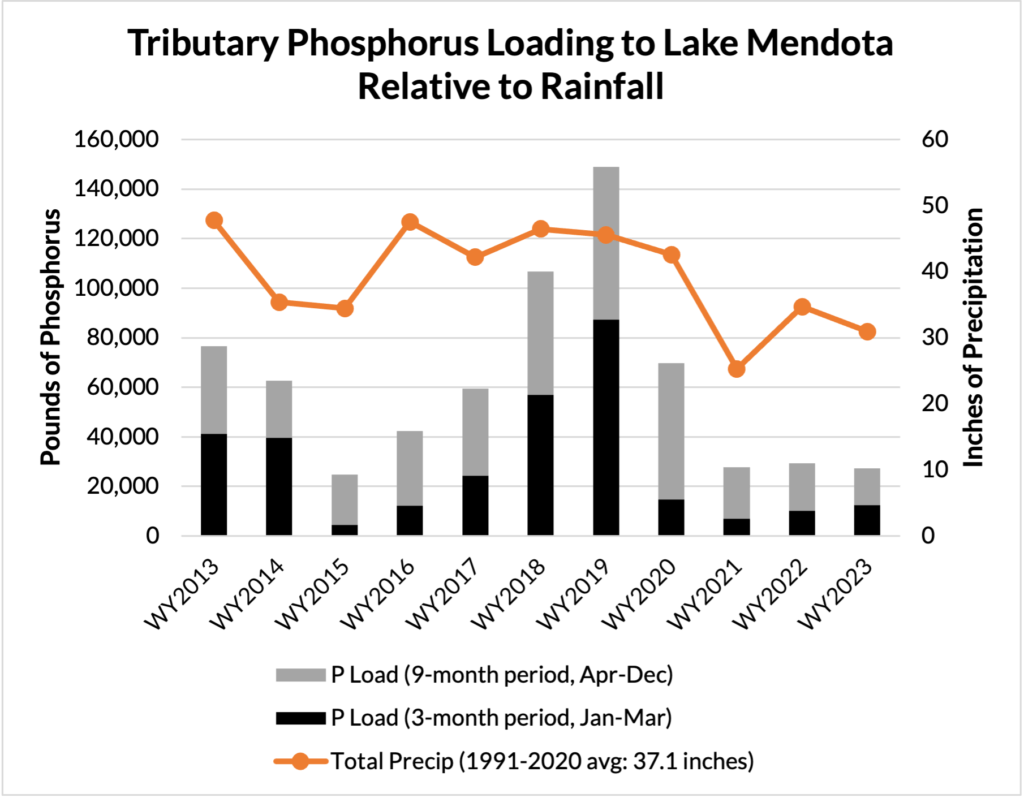
Figure 4: Phosphorus loading through Lake Mendota’s monitored stream tributaries in relation to total precipitation. Phosphorus loading data credit: U.S. Geological Survey. Precipitation data credit: NOAA Regional Climate Center, Dane County Regional Airport.
Figure 4 shows the change in stream-monitored phosphorus loading since 2013. Total precipitation is also plotted in orange to distinguish between wet and dry years. From 2021-2023, average annual phosphorus loading to Lake Mendota significantly declined and has even dipped slightly below target levels. This was largely due to drier weather after years of above-average precipitation, reducing the amount of runoff transporting phosphorus to the lakes. Scientists estimate a doubling of summer days when the lakes are clear and free of algal blooms if these lower levels can be maintained.
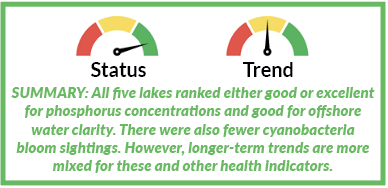
5. In-lake water quality responses
Several in-lake metrics are used to assess overall lake health and track changes over time. Those metrics include water clarity, phosphorus concentration, presence of cyanobacteria (blue-green algae) blooms, and beach closures. Each is summarized in the following figures. All five lakes fared relatively well in 2023 based on these specific health indicators, ranking good to excellent for phosphorus and good for clarity.
Phosphorus
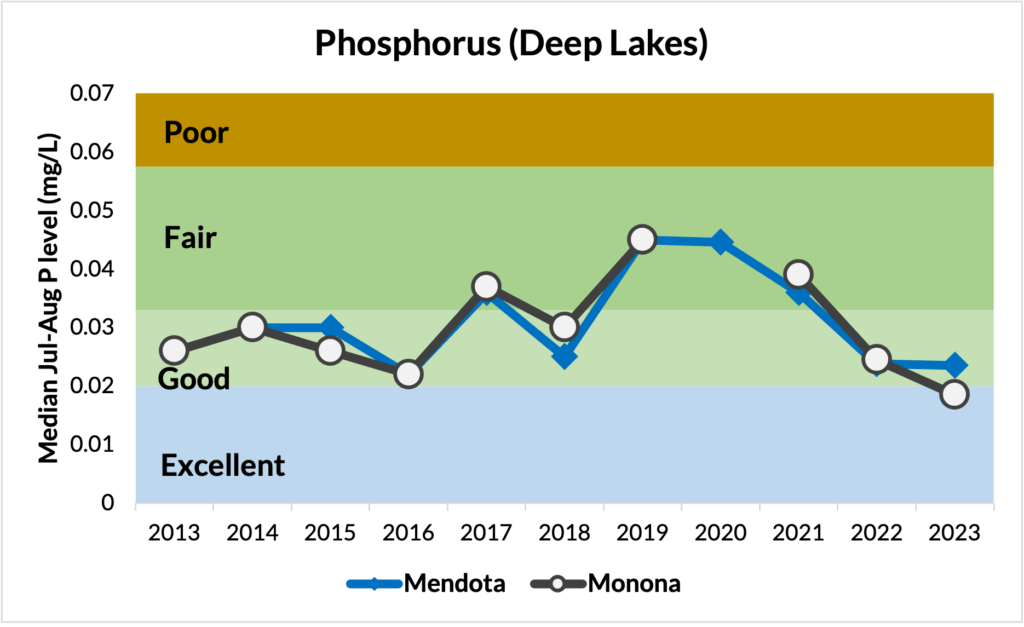
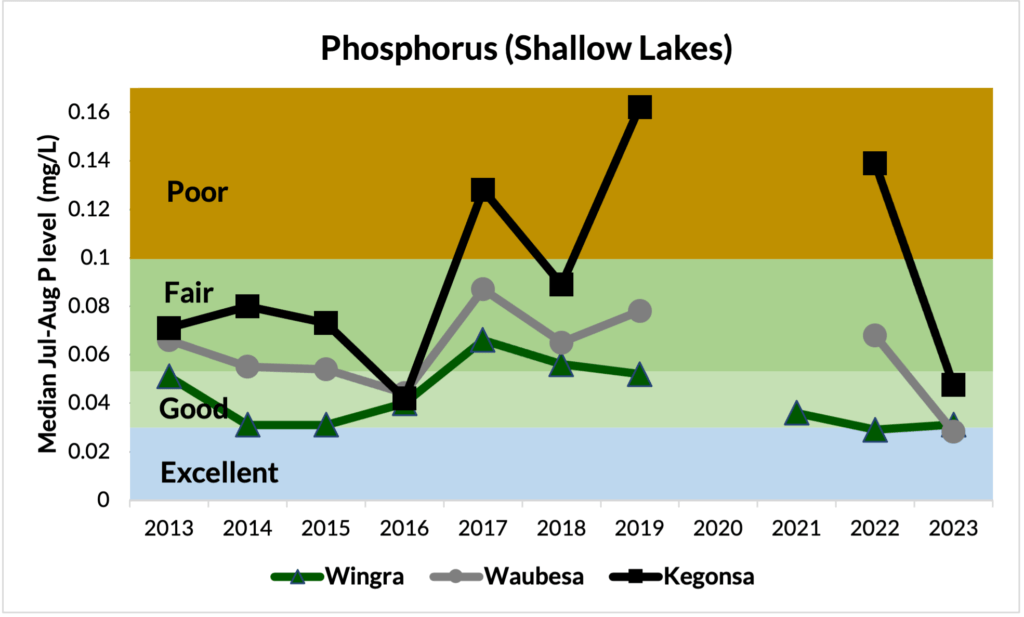
In-lake phosphorus concentrations for all five lakes were comparatively low relative to the prior 10 years, but without any obvious trends over this period (Figure 5). Even when looking at longer time horizons, trends are difficult to identify. When averaged across individual decades beginning in the 1980s, lakes Monona and Waubesa show slight downward trends while those for lakes Mendota and Kegonsa are not evident. This speaks to the reality that more work is needed to reduce phosphorus loading if we hope to improve upon prevailing trends.
Figure 5: Median summer (Jul-Aug) phosphorus concentrations and corresponding water quality classifications by lake type.
Notes: Phosphorus sampling was not performed in lakes Kegonsa, Waubesa, and Wingra in 2020, and in lakes Kegonsa and Waubesa in 2021. Water quality classifications based on Wisconsin Department of Natural Resources’ criteria. Data credit: Richard Lathrop, UW-Madison Center for Limnology.
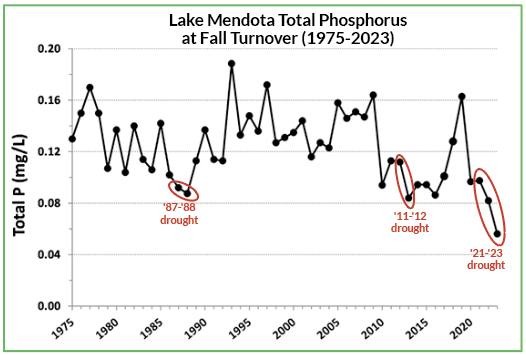
Recent drought years that limit phosphorus delivery because of reduced runoff loadings entering the lakes continue to have a positive effect on in-lake phosphorus concentrations. Lake Mendota’s concentrations after fall turnover hit a new record low in 2023 (Figure 6) following three years of relatively low external phosphorus loadings from the surrounding watershed. Turnover occurs when deeper lakes cool to the point where the water column can completely mix. Higher phosphorus concentrations that have built up throughout the summer in the bottom waters are then mixed throughout the lake. As less phosphorus enters the lake from the watershed, this bottom-water buildup of phosphorus is reduced, thereby reducing internal (in-lake) sources that can fuel algal growth the following year.
Figure 6: Lake Mendota total phosphorus concentrations at fall turnover measured at the lake surface. Credit: Richard Lathrop, UW-Madison Center for Limnology.
Fall turnover phosphorus concentrations were also low in 1988 and 2012 following those extended droughts. This shows that Lake Mendota’s phosphorus levels decline when loading from the watershed is reduced. Similar responses occurred following the wet, high-loading years of 2008 and 2018-19 when fall turnover phosphorus concentrations were very high. Soon after these years, Lake Mendota’s phosphorus status quickly dropped back to more average levels. This is another sign that reduced external loadings from the surrounding watershed can result in significant and relatively quick water quality improvements.
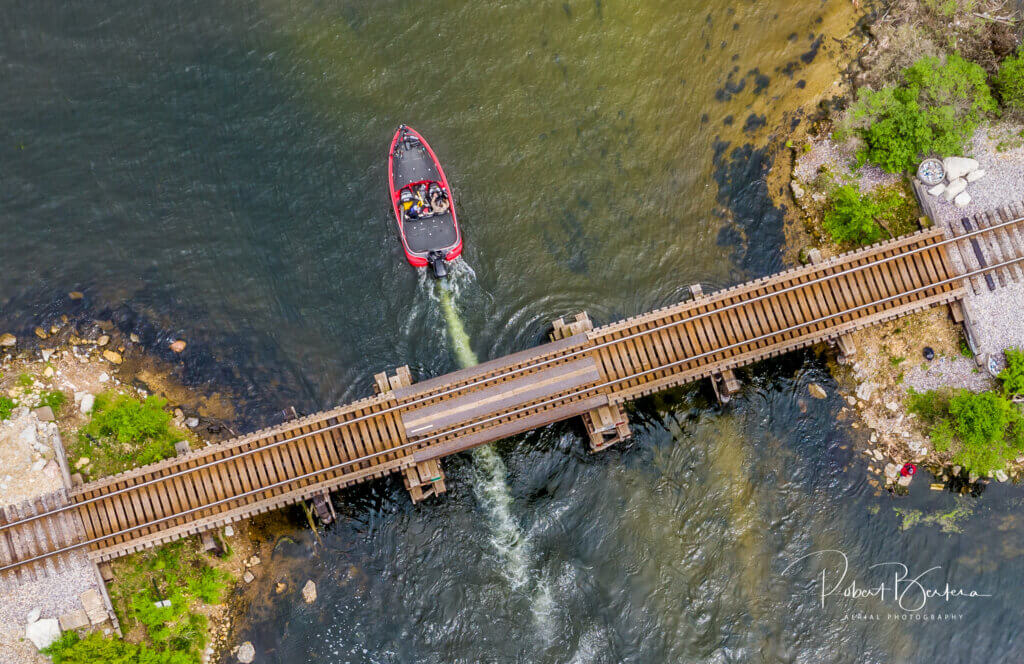
Boating on Lake Waubesa, courtesy Robert Bertera
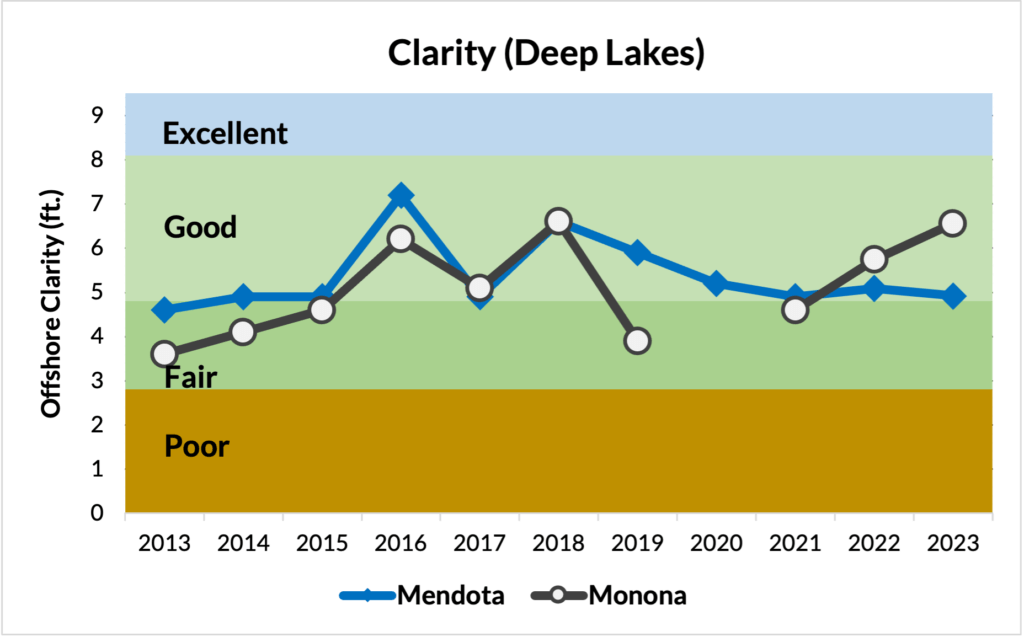
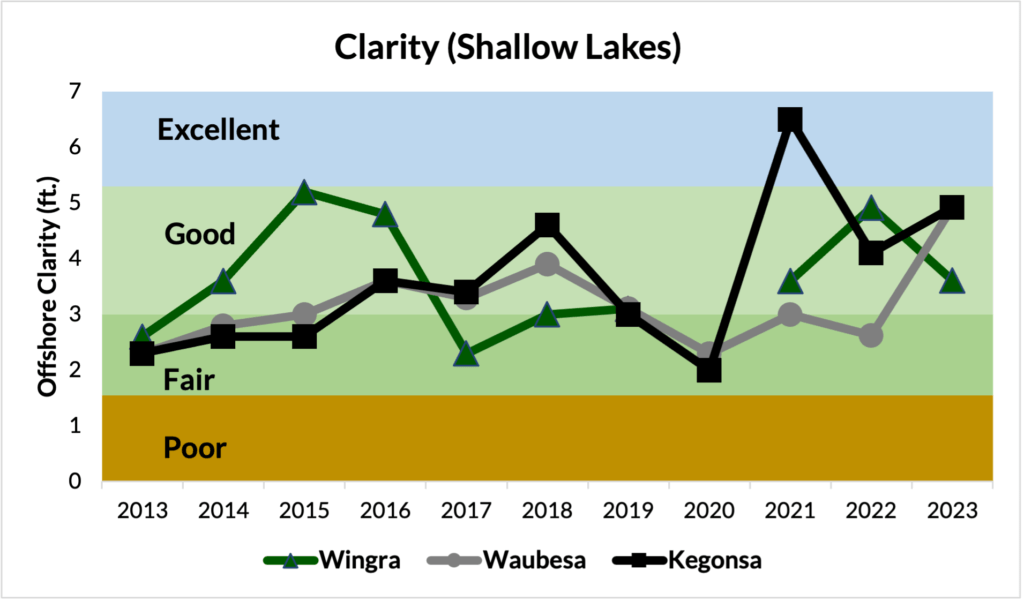
Water Clarity
Offshore water clarity for all five lakes was comparatively high relative to the prior 10 years, with median summer values generally trending higher over this period (Figure 7). However, when looking at longer time horizons, trends are more mixed. When averaged across individual decades beginning in the 1980s, lakes Mendota and Waubesa show slight downward trends while those for lakes Monona and Kegonsa are not discernible.
Figure 7: Median summer (Jul-Aug) offshore water clarity readings and corresponding water quality classifications by lake type.
Notes: Water clarity information was not available for lakes Monona and Wingra in 2020. Water quality classifications based on Wisconsin Department of Natural Resources’ criteria. Data credit: Richard Lathrop, UW-Madison Center for Limnology.
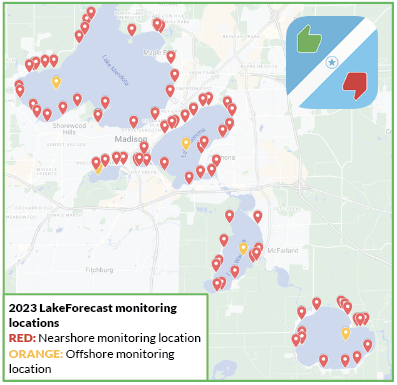
Because water clarity often varies across a given lake, Clean Lakes Alliance uses a network of trained volunteer monitors to collect additional data through its LakeForecast program. From Memorial Day through Labor Day, monitors submit at least twice-weekly reports on water clarity, water temperature, and the severity of floating green algae and cyanobacteria blooms (among other variables). This information can be seen in near-real-time on LakeForecast.org and the free LakeForecast app, allowing the public to stay up to date on current lake conditions. These reports are also used to raise awareness about changing water quality conditions, advocate for improvement projects, and inform this annual State of the Lakes.
Figure 8: LakeForecast monitor locations
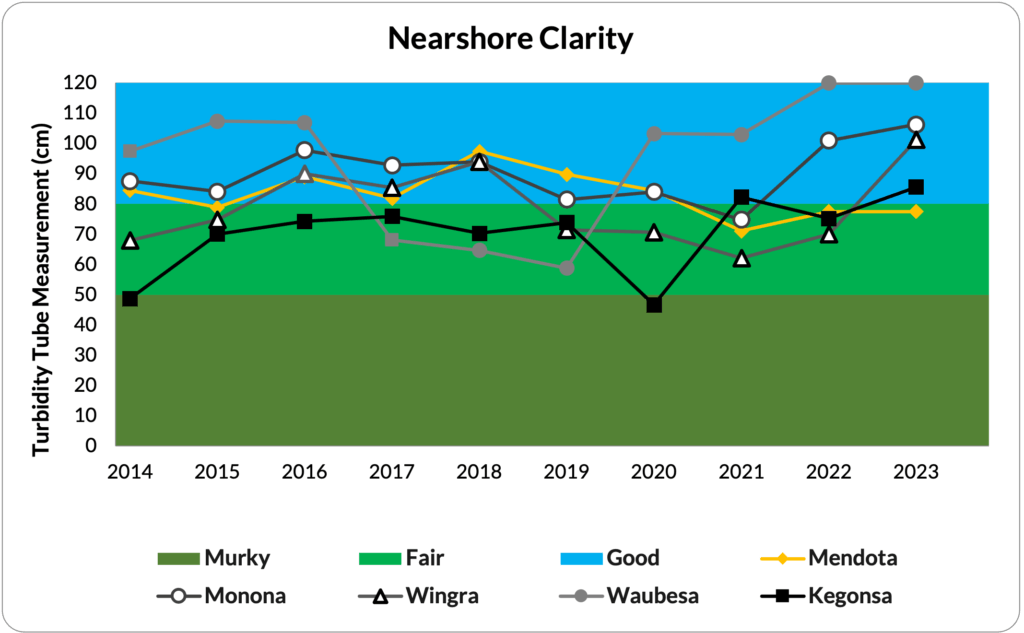
To measure nearshore clarity, monitors use a sampling device called a turbidity tube to report conditions at nearly 90 sites spread around all five lakes (Figure 8). Figure 9 shows the median summer (Jul-Aug) clarity readings for each lake from 2014-2023. Values under 50 as measured on the 120-cm device are considered “murky,” between 50-80 “fair,” and between 80-120 “good.” Consistent with offshore clarity readings using a Secchi disk, most values for 2023 fell within the good range, except for Lake Mendota which was at the upper range of fair.
Figure 9: Median summer (Jul-Aug) nearshore clarity readings for each lake (2014-2023).
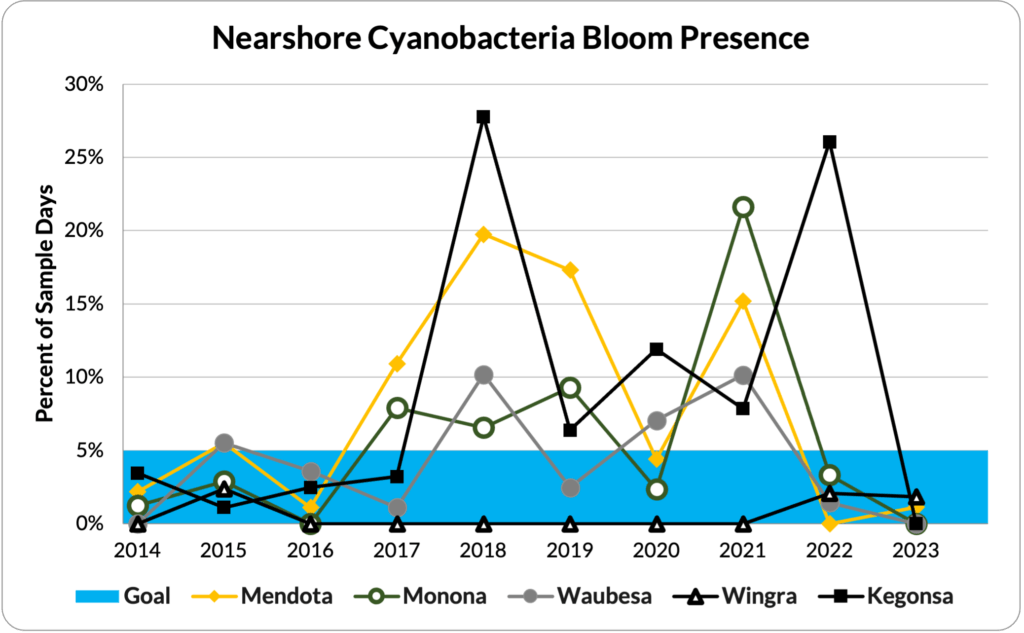
Cyanobacteria Blooms
To determine cyanobacteria bloom frequency, the number of days on each lake with at least one report of a strong cyanobacteria bloom observed within the individual monitoring sites was counted. By dividing the number of “cyanobacteria bloom days” by the total number of sampling days for each lake, a percentage is generated representing how often the monitors observed at least one major bloom within their sampling area. This method lessens overreporting in situations when different monitors report the same cyanobacteria bloom.
Figure 10: Percent of sampling days (Jun-Aug) when strong evidence of a cyanobacteria bloom was observed at one or more sites on each lake.
Figure 10 shows the percentage of sampling days when strong evidence of a cyanobacteria bloom was observed on each lake (2014-2023). Overall, monitors reported comparatively low cyanobacteria blooms during the 2023 sampling period (Jun-Aug), with most of the significant blooms occurring early in the season. Monitors on lakes Monona, Waubesa, and Kegonsa did not report a single significant bloom. This is welcome news after 2022’s record-high bloom count on Lake Kegonsa. Lake Wingra experienced similar bloom counts to 2022, and Lake Mendota had a handful of significant blooms reported in 2023 after not experiencing any in 2022.
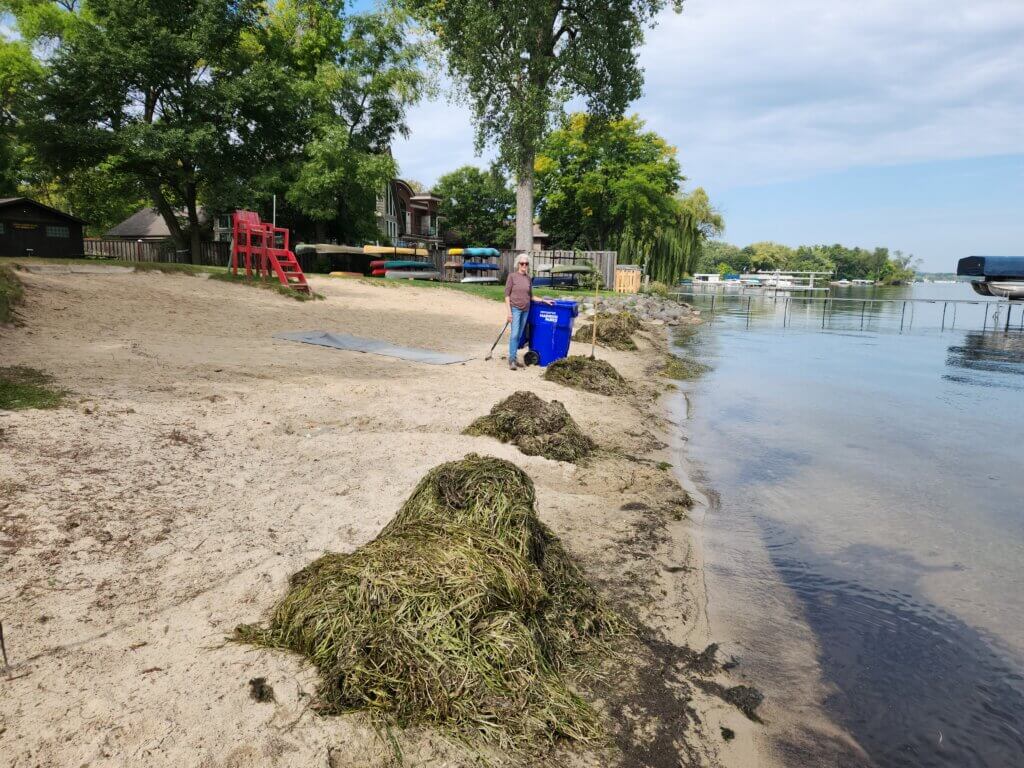
Clean Lakes Alliance volunteer removes aquatic plant debris from Spring Harbor Beach in September 2023
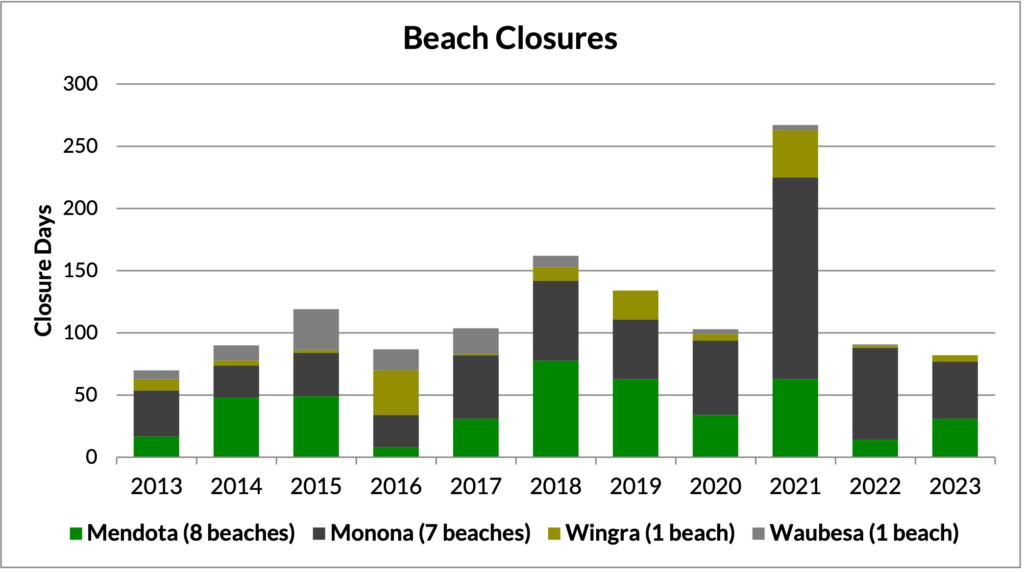
Beach Closures
Beach closures are another useful indicator of general lake health. Clean Lakes Alliance looks at closure data provided by Public Health Madison & Dane County for 17 beaches (Figure 11). Covering four of the five Yahara lakes, these tested public beaches were selected due to the consistency of tracking data over the prior 10-year period. Results are reported as total closure days recorded for each season, roughly running from Memorial Day to Labor Day. For example, if two beaches on a given lake are closed for a total of five days each, 10 closure days would be reported for that lake.
Figure 11: Beach closure days by lake. Includes beaches consistently monitored since 2013. Lake Mendota: Governor Nelson, Warner, Mendota County, James Madison, Memorial Union Pier, Marshall, Tenney, and Spring Harbor; Lake Monona: B.B. Clarke, Bernie’s, Brittingham, Esther, Hudson, Olbrich, Olin; Lake Wingra: Vilas; Lake Waubesa: Goodland County; Lake Kegonsa: None. Data credit: Public Health Madison & Dane County.
Closures are most often the result of high cyanobacteria and/or E. coli bacteria levels, with closure rates strongly influenced by timing and frequency of testing. Most beaches are tested once per week and then daily for beaches with a closure in effect. Cyanobacteria blooms, which are generally a product of high lake fertility, can be dangerous due to their potential to release toxins that can harm people, pets, and wildlife. High E. coli bacteria concentrations can also be harmful as they are an indicator of human or animal fecal matter in the water that may contain dangerous pathogens. In 2023, there were 82 beach-closure days reported, which is below both the long-term median and the 92 closures reported in 2022. Closures were relatively split between cyanobacteria and E. coli as the causes.
Growing Stewardship
Clean Lakes Alliance remains committed to fulfilling its vision of making Greater Madison renowned for its healthy lakes, lands, and waters. We do this through our daily mission to champion the lakes and watershed stewardship for the benefit of all. We are also proud to have assembled and led the 19-member partnership coalition, called the Yahara CLEAN Compact, that signed off on an updated lake-cleanup plan. RENEW THE BLUE: A Community Guide for Cleaner Lakes & Beaches in the Yahara Watershed (2022) reaffirmed goals and is now guiding action across multiple stakeholder groups.
Achieving and sustaining healthier local lakes is entirely possible. Increased awareness, involvement, and progress on needed project action are helping to move us in that direction. But more work and investment are clearly needed, and it will take all watershed stakeholders playing an active role to get us there. To learn more about the lakes and what you can do to help, visit cleanlakesalliance.org/renew-the-blue.
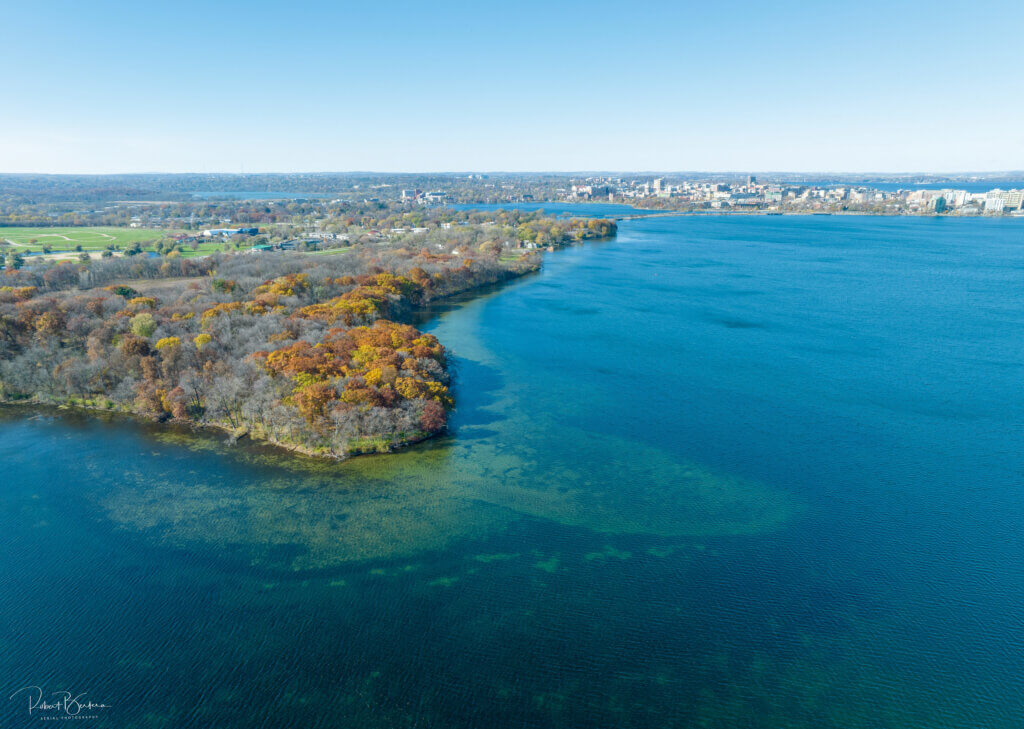
Clear water in November 2023 allows a view of the sandy bottom of Lake Monona near Turville Point
Photo courtesy Robert Bertera
About the State of the Lakes
The annual State of the Lakes is released each year as part of the Greater Madison Lake Guide. In it, we report out to the community on the state of water quality in our lakes. The report also looks at our collective progress toward our phosphorus reduction goal.
The report highlights information from many partners to share the most up-to-date science on water quality in our lakes. We feature local projects, including work in urban areas to protect stormwater quality and progress on farms to keep nutrients on the fields and out of our lakes.
In addition, we provide more information about Clean Lakes Alliance and our efforts to engage the community and advocate for the lakes. This report serves as a reference and a resource, highlighting community progress toward cleaner, healthier lakes for all.