fbpx

News

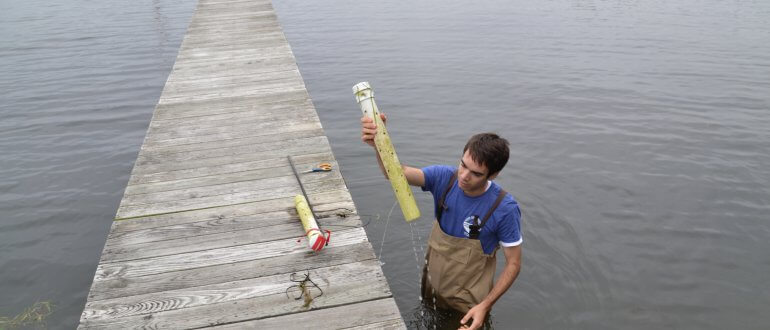
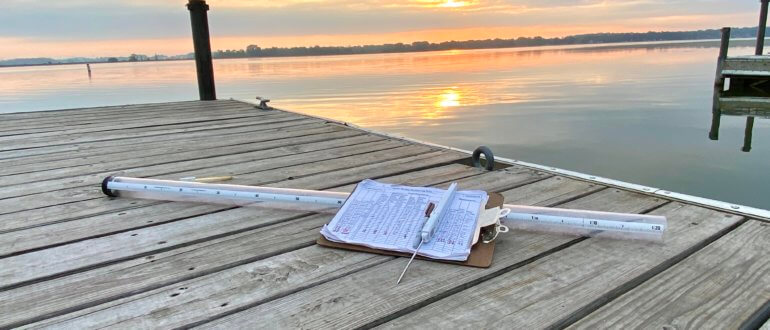
Water quality monitoring equipment

LakeForecast water quality monitoring in 2021

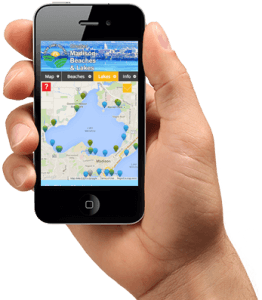
In 2021, our volunteers embarked on the 9th season of LakeForecast water quality monitoring. This work involved collecting nearshore condition reports at piers, beaches, parks, and access points around the five Yahara lakes. From May through September, volunteers took water quality measurements. They measured water clarity, recorded air and water temperature, identified the presence of green algae and cyanobacteria, and noted additional visual observations. Reports are entered into the LakeForecast app where all data are updated in real time.
Read More

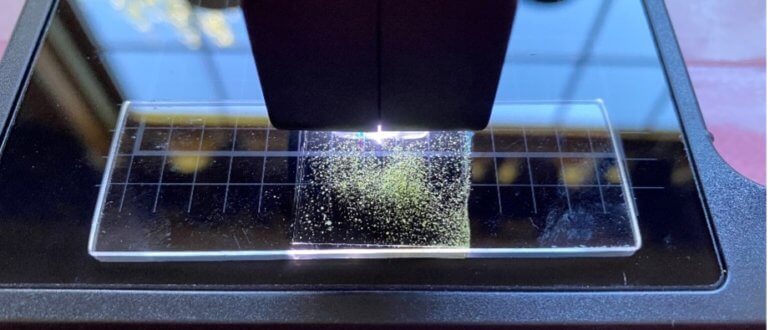
Iolight portable microscope

New opportunities to learn about and help our lakes can arise unexpectedly. Such is the case when Madison Gas and Electric‘s Jeff Jaeckels reached out to Clean Lakes Alliance about a research group looking for volunteers to study the lakes in a novel way. Studying the lakes through artificial intelligence will allow Clean Lakes Alliance and our partners to better monitor and research harmful algal blooms.

Read More

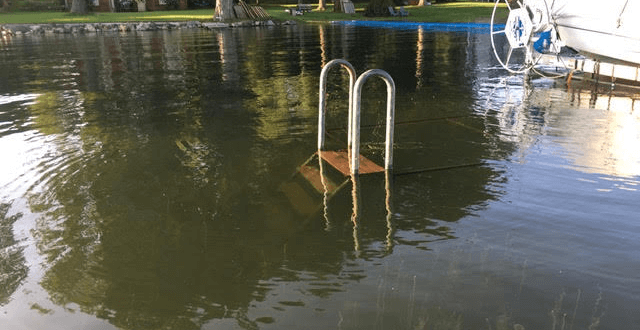
2018 Flooding

Yahara Lakes 2018 Water Quality Monitoring Results

Overview

From May to September of 2018, water quality monitoring took place at piers and beaches around the five Yahara lakes. Volunteers measured near-shore water clarity, air and water temperature, and noted several visual observations. Visual observations included presence of algal blooms (green/blue-green), floating plant debris, swimmers, waterfowl, wave intensity, and general water appearance. Volunteers report conditions on our website, Lakeforecast.org. The website displays updated data in real time.

Highlights

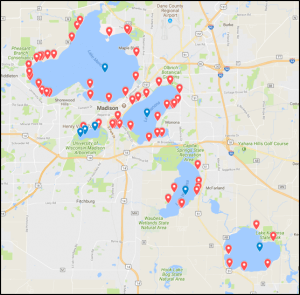
  • 79 near-shore and 7 offshore monitoring stations on all five Yahara lakes (Figure 1)
  • Weekly off-shore measurement of Secchi depth on all five lakes
  • Measured temperature and dissolved oxygen profiles on all five lakes (seven sites total)
  • Weekly monitoring continued at all 25 public beaches
  • 44% increase in number of condition reports from 2017 (Table 1)
  • Collected continuous near-shore temperature measurements at 17 sites on lakes Mendota, Monona, and Waubesa, and Kegonsa
  • Implemented E. coli sampling and cyanobacteria toxin testing pilots
  • Averaged 2.3 condition reports per site each week across all sites
  • Continued weekly Weekend Lake Reports with over 77,000 views on social media
Read More

Water quality monitoring

2017 results from our monitoring program

Overview

Figure 1. 2017 monitoring sites (Red: Near-shore; Blue: Off-shore).

From Memorial Day to Labor Day, volunteers at piers and beaches around the five Yahara lakes measured near-shore water clarity, air and water temperature, and noted several visual observations.

Visual observations included presence of algal blooms (green/blue-green), floating plant debris, swimmers, waterfowl, wave intensity, and general water appearance.

Volunteers were asked to log condition reports at least weekly on our website, lakeforecast.org, where all data are updated in real time.
Read More